Earlier this year I was part of a great team of data science volunteers analyzing evictions and foreclosures across the USA, a project organized by DataKind.
DataKind connects data scientists with non-profits that have a data-driven problem. In this project we were partnered with New America, a think tank who have been working on housing instability in the USA.
When we started the project at the beginning of 2020, we could not have forseen that a pandemic was about to create a major housing crisis and make our work incredibly timely. Unfortunately, one of our more interesting findings from a data science perspective was that there is no comprehensive dataset of housing loss in the USA, as the data for many counties is simply not available.
From the official New America Displaced in America report:
Between 2014 and 2016, the national average housing loss rate was 2 percent, meaning that each year, two out of every 100 households who either rent or have a mortgage experienced an eviction or mortgage foreclosure. Housing loss was most acute in Arizona, Nevada, and Florida, where rates of housing loss were greater than 3.8 percent, almost twice the national average.
and the DataKind summary:
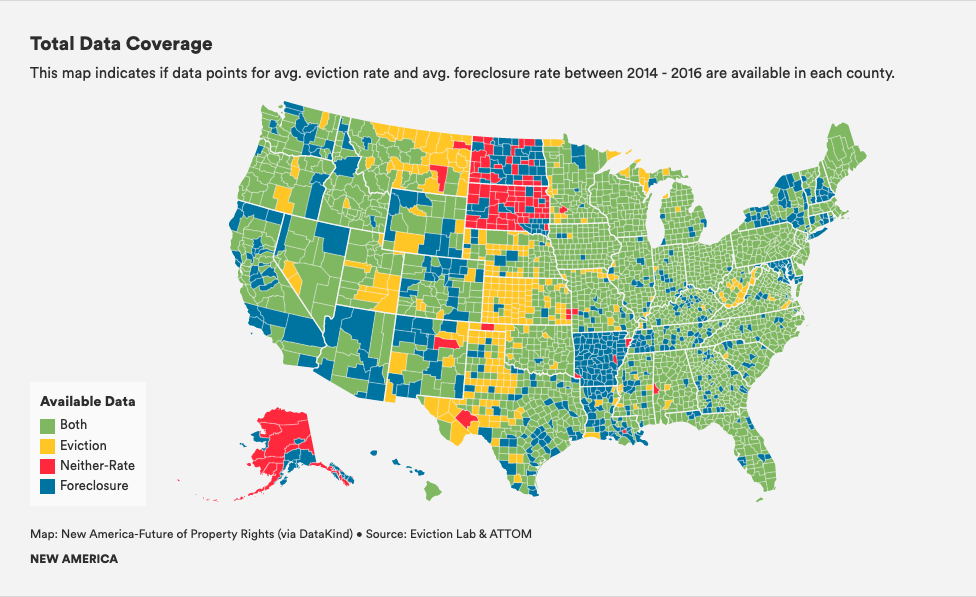
Diving into the data, the team adopted a cross-functional and hands-on approach to tackle this project. First, they began with an exploratory data analysis of all the information that was available to understand the data and showcase trends and insights at the National level and in specific deep-dive locations. One initial finding was that data availability varies widely and many locations did not have both foreclosure and eviction data available - in fact, only two-thirds of counties in the United States had data on both types of loss.